
Verksamhetskoll Planning · Custom analysis
Building your own reports? Build them on ready figures.
Orders and order backlog, staffing and sickness absence from the payroll system, project estimates and volumes: what sits outside the accounting system, crossed with the books in Verksamhetskoll. Build the reports yourselves in Power BI, on quality-assured dataflows, and have them embedded in your Verksamhetskoll.
The books say what it cost. Your systems say why.
The answers appear when two sources meet in the same model. Some of the questions customers ask.
Transport
What does every 10 km cost, per vehicle and per customer?
Vehicle data and distance driven against booked costs per cost centre.
Wholesale and logistics
What contribution margin does each order and customer give?
Revenue per order from the order system against booked costs.
Construction and projects
Does the estimate hold against the outcome, project by project?
Project estimates with payment plans against actuals per project in the books.
Consulting and staffing
What does a billed hour yield, per assignment and person?
Time reports and staff lists against invoiced amounts and payroll cost.
Manufacturing
What does a unit produced cost, this month against last?
Production volumes against material and staff costs per month.
All industries
Is staffing enough for the order backlog in the coming months?
The order backlog per delivery month from the order system against staffing from the payroll system and payroll cost in the books.
Your systems in ready dataflows. The books already in place.
The heavy part of every BI project is the source data: fetching it, cleaning it, keeping it updated, getting the keys to match between the systems. We do that work, once, and then every night.
- Your systems are fetched in dataflows. Order systems, payroll systems, project estimates, time reports, vehicle and production data. Files, APIs or databases via a gateway, in your workspace.
- Quality-assured, not just fetched. A fixed structure and keys that match the books: company, customer, project, cost centre. If the source changes, the load stops with yesterday's data kept.
- The books arrive ready. Accounts with Verksamhetskoll's headings, transactions with counterparty and dimensions, your own statement layouts. Whichever accounting system you use.
- Updated every night. After the fetch from the accounting system, through a connection to Hogia, Fortnox or Spiris. Companies on SIE 4, the Swedish standard format for exporting accounting data, follow along when a new file is read in.
- A versioned contract. Columns are never removed or renamed without a version change, so the reports you build do not break.
What you get ready from your systems
- Order system and point of saleorder intake, order backlog, delivery dates, customers
- Project estimatesestimate and payment plan, often in Excel as it is
- Payroll and staffstaffing, sickness absence, time reports, payroll cost
- Volume and key ratiosdistance driven, hours, let area, units produced
- Property and energylet area, vacancy, kWh from the energy meters
- Transport and business systemsrevenue per order, per customer, per route
From the books, via Verksamhetskoll
- Accountswith Verksamhetskoll's headings and reclassifications
- Transactionsevery journal entry line with counterparty and dimensions
- Statement layoutsyour own income statement and balance sheet layouts
- Companies, years, opening balancesall companies in the account, even broken years
Field names in plain language, the same words as in Verksamhetskoll: Account group, Account heading, Company, Customer/supplier, Cost centre.
Your own Power BI reports in the browser. All sources in one model.
If someone on your side wants to get stuck into the reporting themselves, you get a build workspace of your own with the same data model as our deliveries. You build, we look after the foundation.
- Your systems and the books in the same model. The relationships are in place: the customer in the order system is the same customer as in the books, the project in the estimate the same project, the department in the payroll system the same cost centre.
- A start report to build from. Start here explains how in four steps and has an empty page to build on.
- The figures cannot be changed, only shown. The measures are ready and calculated as in Verksamhetskoll. If a measure is missing, we add it.
- AI as a sounding board. Field names in plain language and ready measures make the model easy to describe to an AI assistant. Nobody needs to be a BI expert to get started.
- The report can become a tab. The one you are happy with is designated as Custom analysis in Verksamhetskoll.
How you build
- 1
Open your build workspace in Power BI, in the browser. Nothing to install.
- 2
Save a copy of Start here the start report explains how in four steps.
- 3
Drag in fields and measures revenue, costs, actuals and your own sources are ready.
- 4
Save, share, or make it a tab in Verksamhetskoll, so colleagues see it where they already are.
Whoever builds or opens the tab needs a Power BI Pro licence. The standard product requires none.
SEK per 10 km. Net operating income per square metre.
A haulage company and a property company, each with an operational system of its own crossed with the books. The same approach works for your own systems.
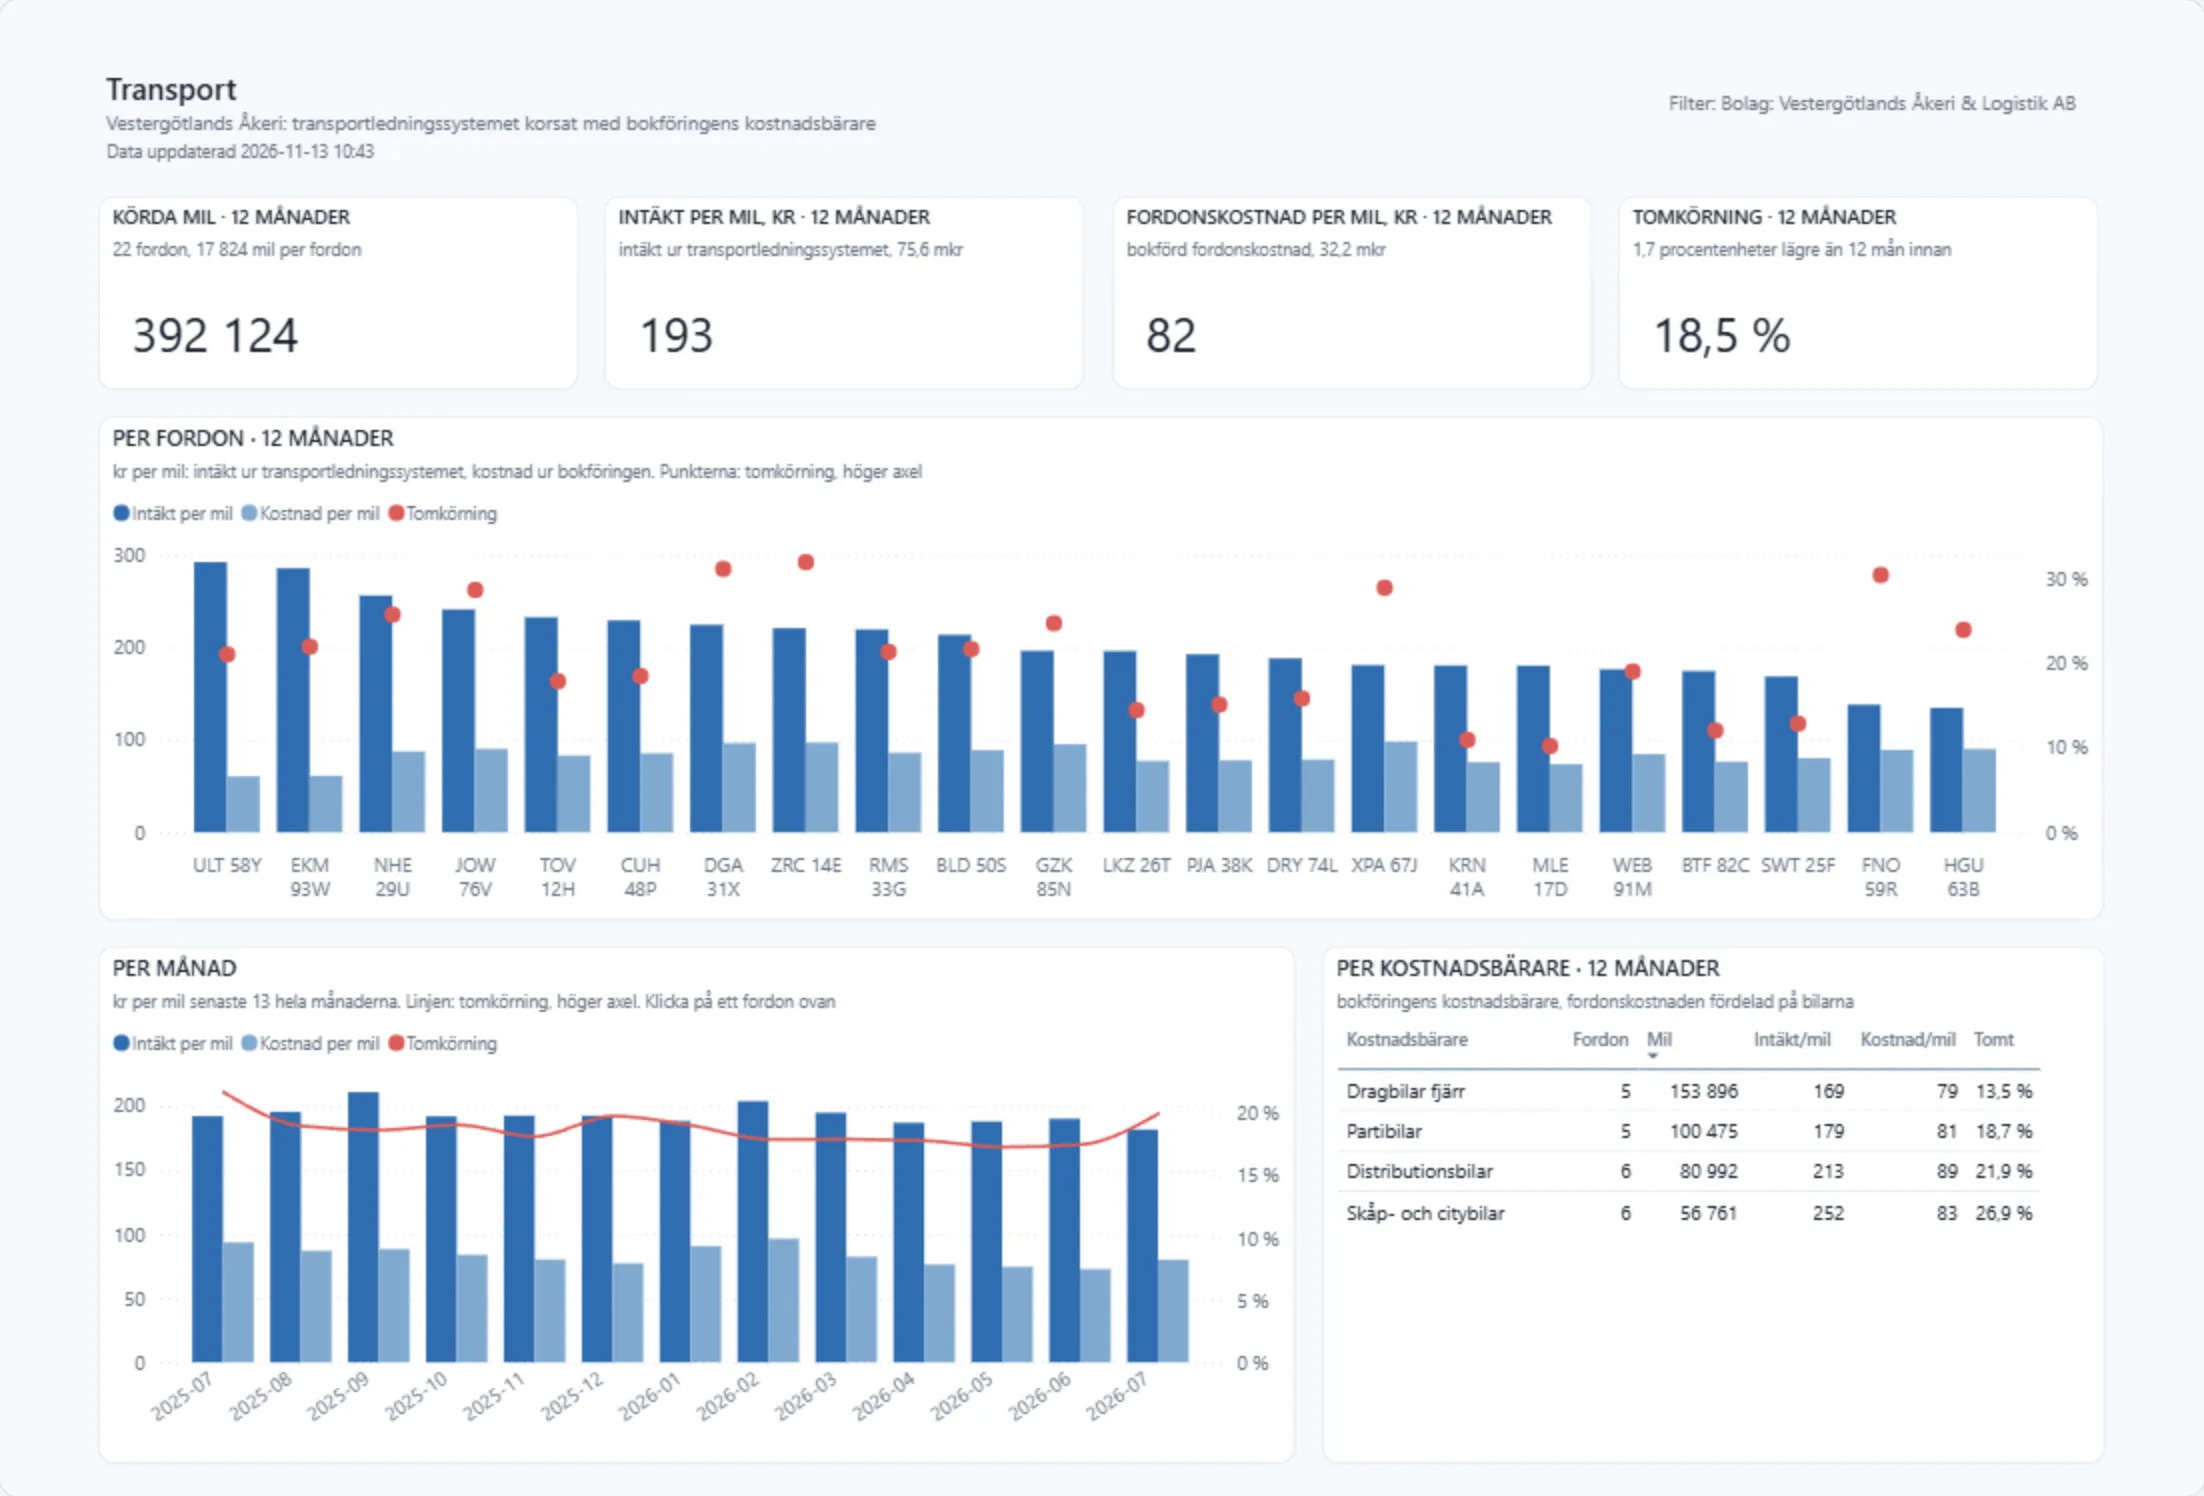
- The haulage company: distance driven and empty running from the transport management system against booked vehicle cost. Revenue and cost per 10 km for each vehicle, and which vehicles run empty.
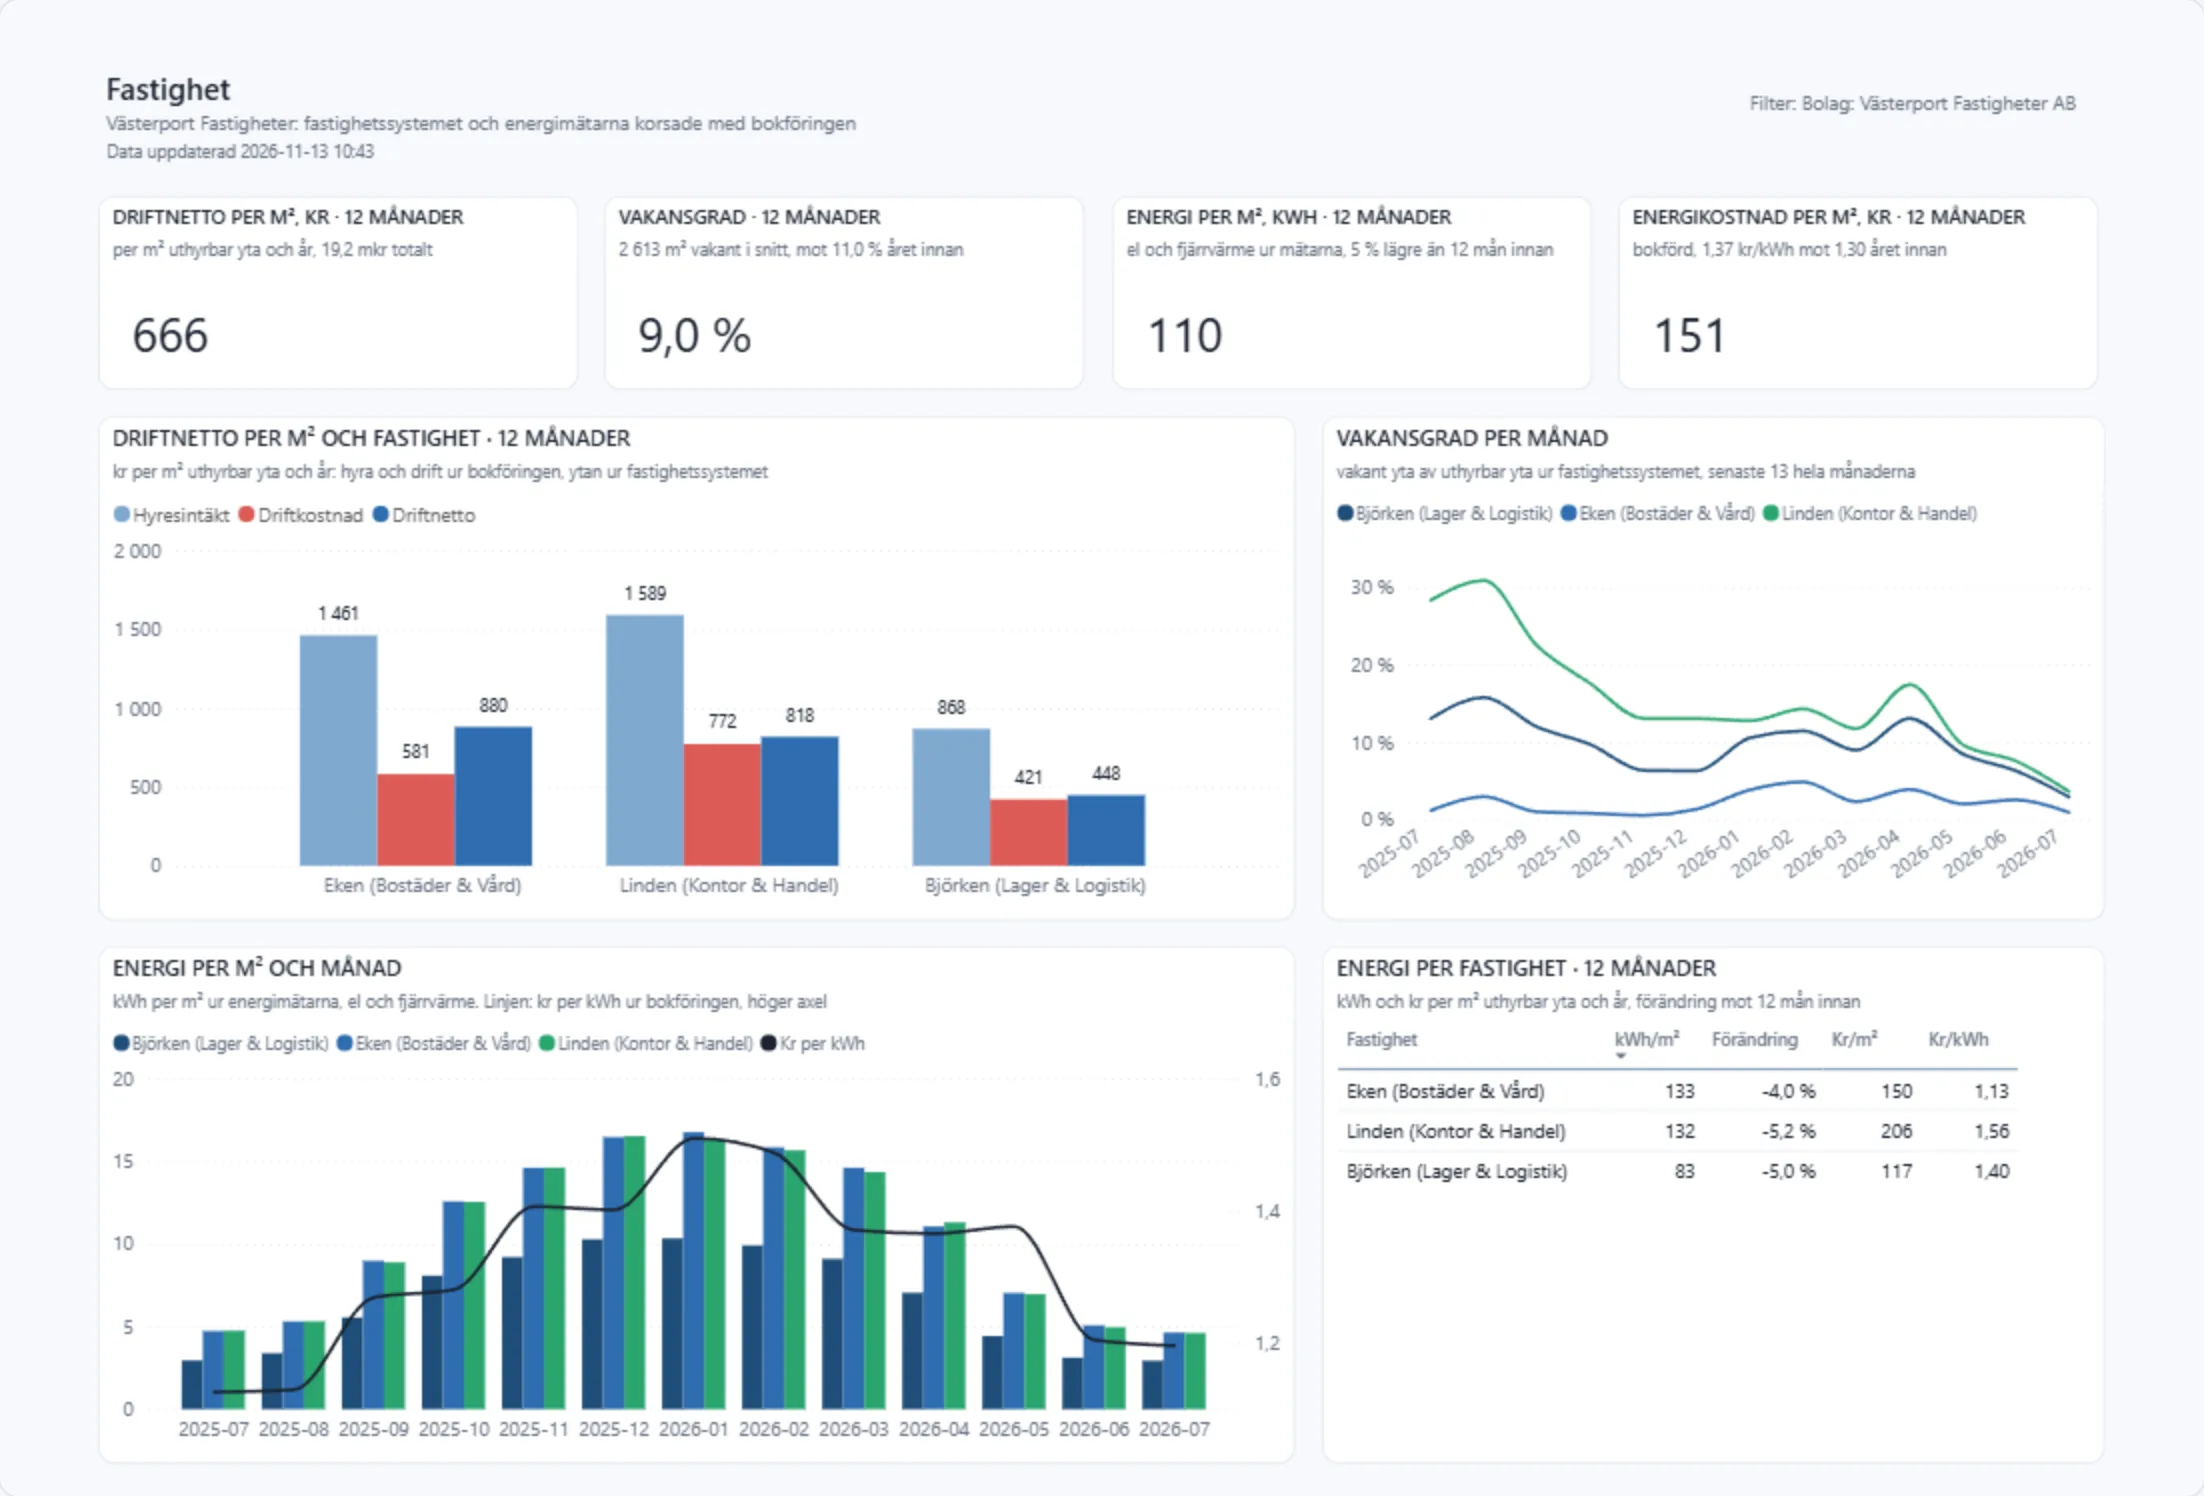
- The property company: let area and vacancy from the property system against rent and operating costs in the books. Net operating income and vacancy rate per property.
- Energy, month by month. kWh per square metre from the energy meters next to the price per kWh from the books. Then you can see whether it is consumption or price that drives the cost.
- The books' dimensions carry the crossing. If costs are booked per cost carrier or property, they end up on the right vehicle and the right building.
Order systems, estimates and staff against the books.
When figures from your systems are to be crossed with the finances, we build the analysis: a fixed scope, priced in a quote, ready as a tab in Verksamhetskoll. This is what we have delivered.
- The construction company: the project managers' own Excel forecast with payment plans, read in as it is and crossed with actuals per project. Now updated every night and shared with everyone.
- The logistics company: revenue per order from the transport system against booked costs, contribution margin per customer, SEK per 10 km. Plus a build workspace of its own for the next question.
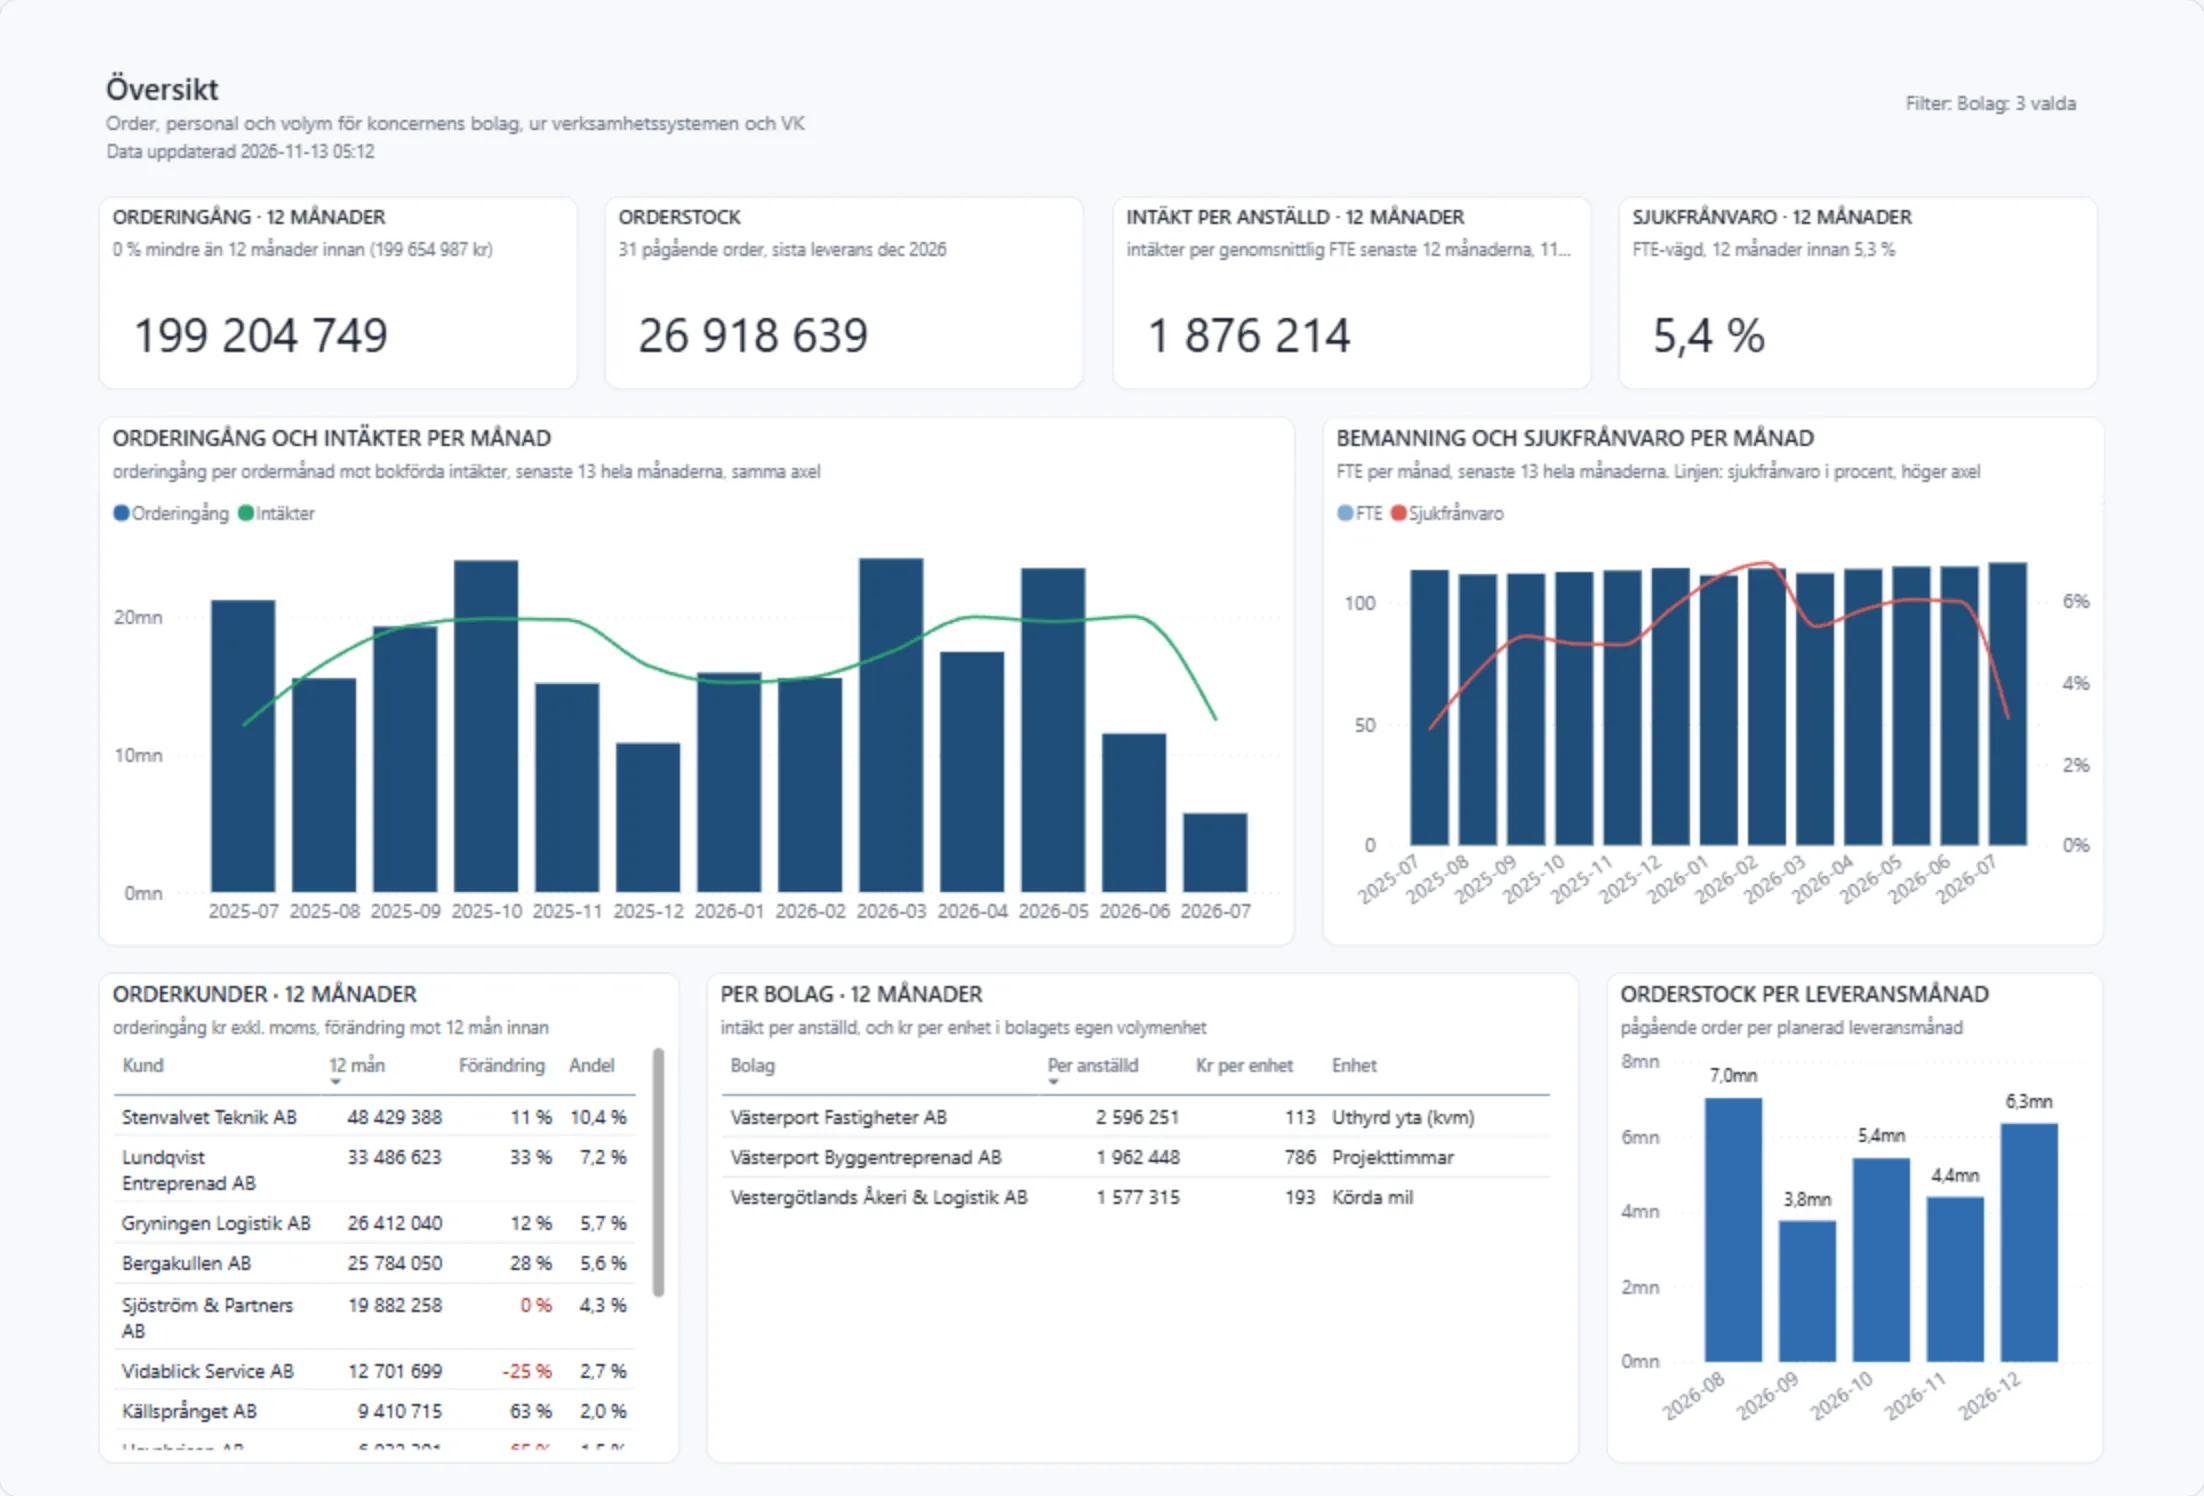
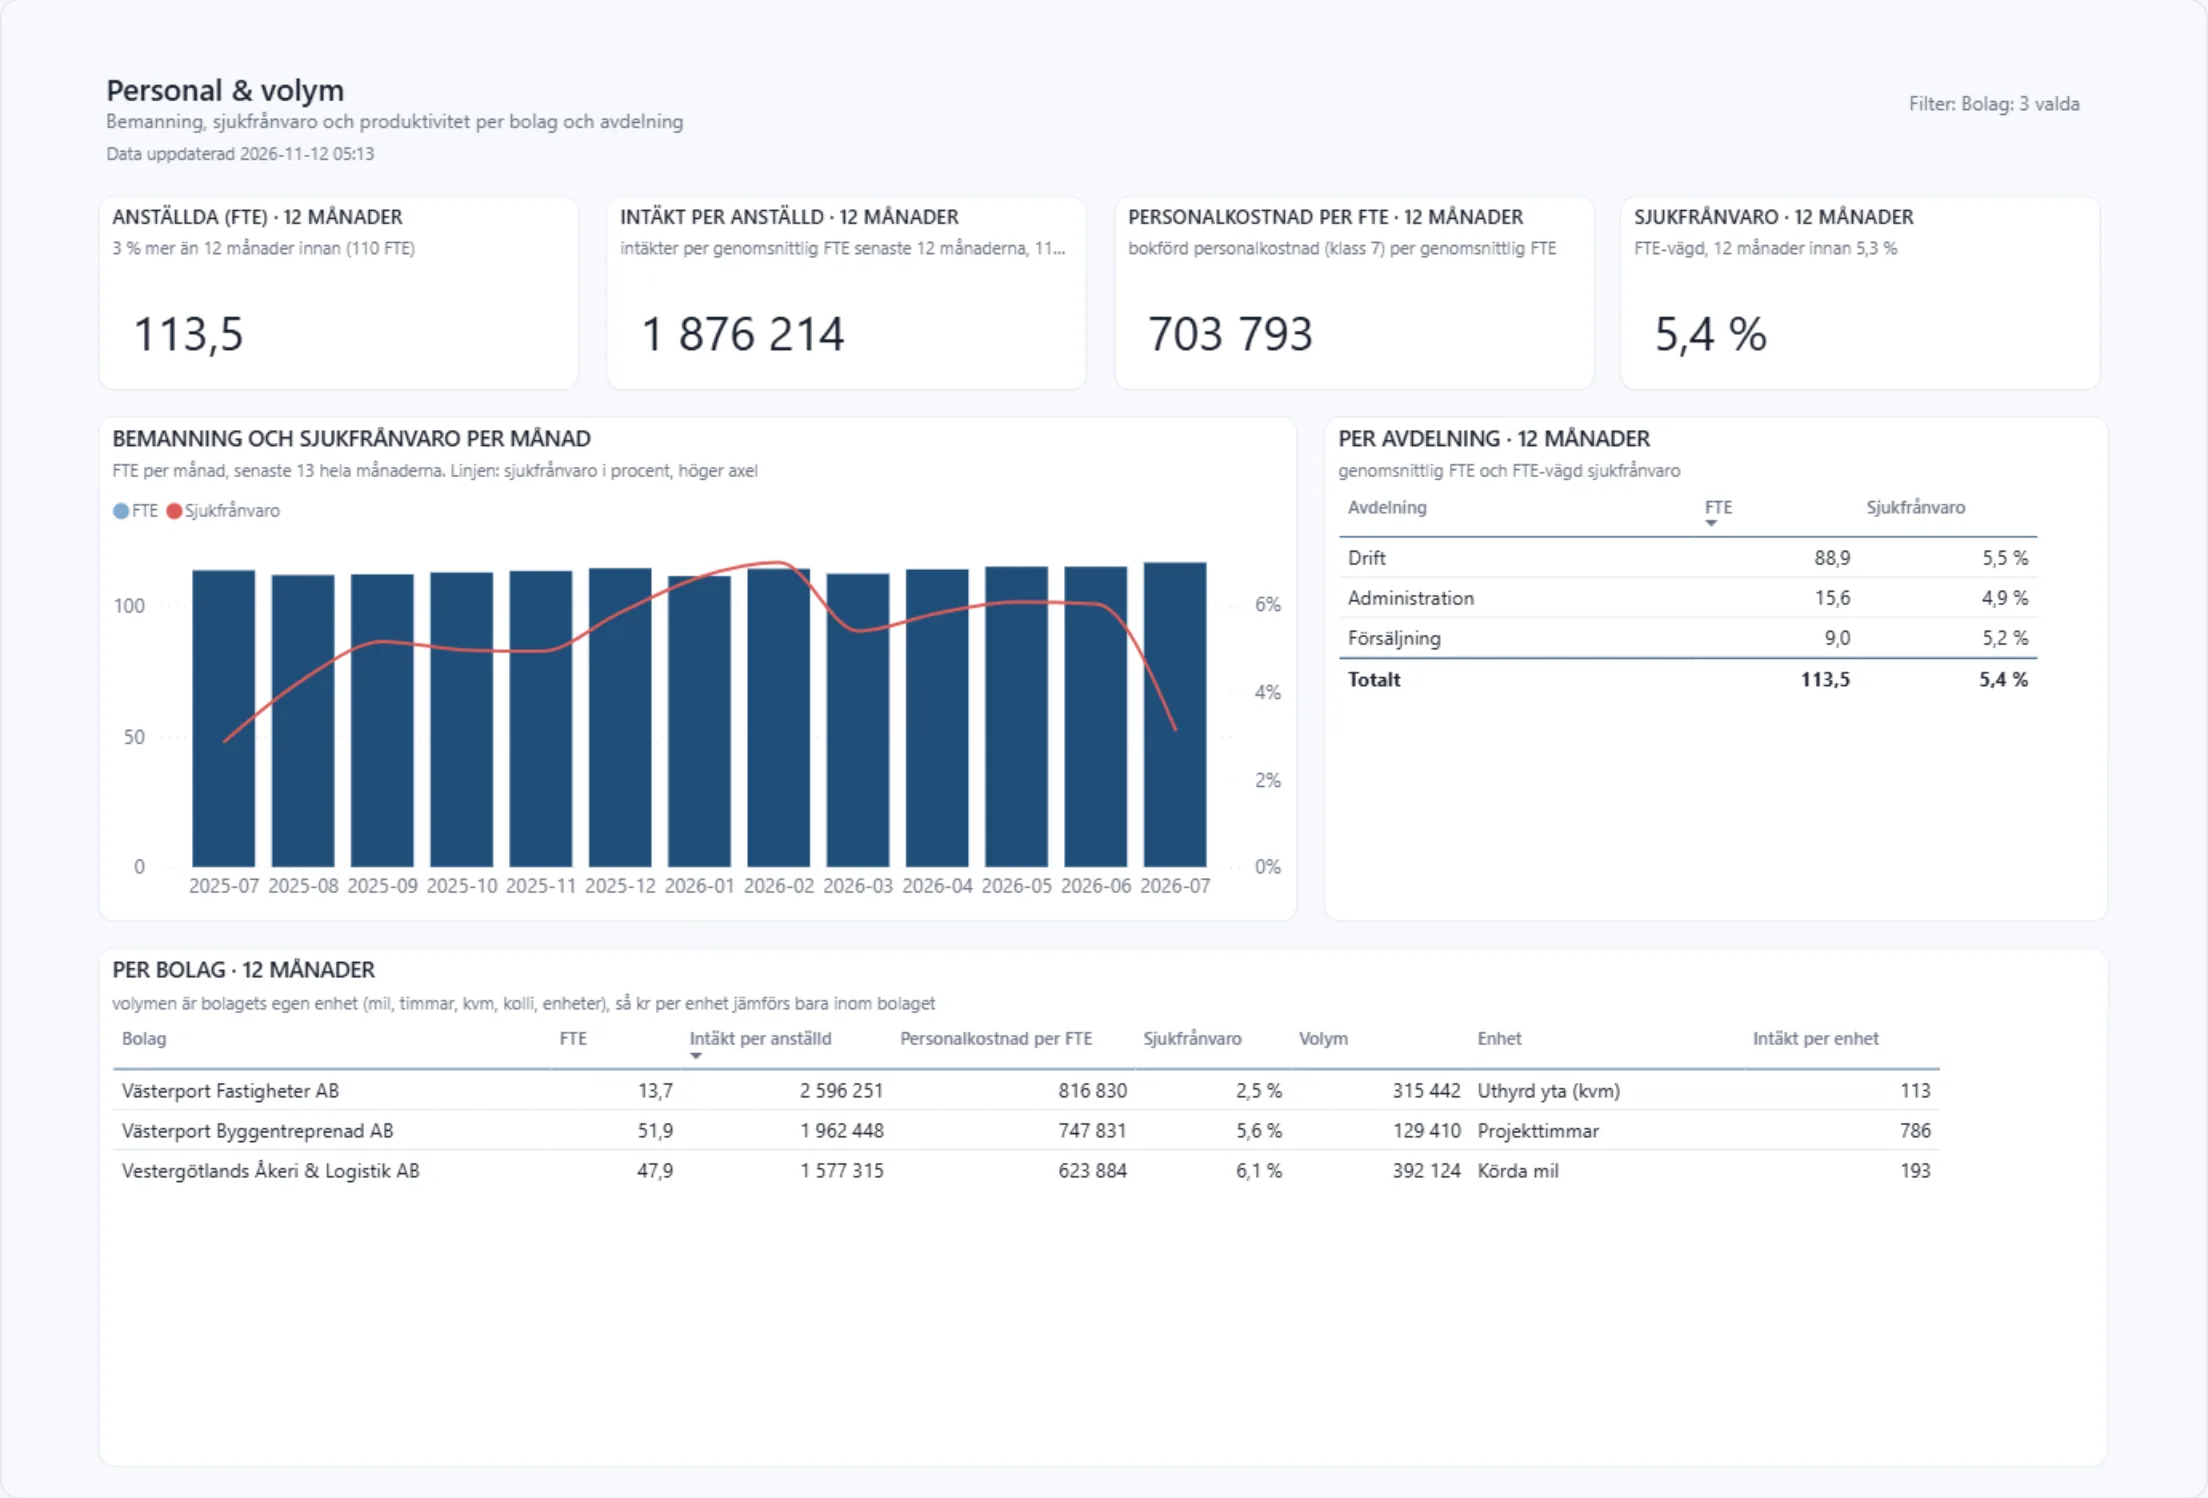
- Staff and volume: staffing and sickness absence from the payroll system, revenue and payroll cost per employee, and each company's volume in its own unit: distance, hours or square metres. As in the picture, from the demo.
- The flow goes one way. The analysis reads Verksamhetskoll, never the other way round. Budget, forecast and health index are left untouched.
The Excel report with one tab per system. Then it had to be shared.
More and more people build their own reports in Excel, often with AI helping: a tab from the order system, one from the books and a VLOOKUP in between. It is quick. The problems come afterwards, and they have nothing to do with the charts.
- The source data is pasted in by hand, twice. Every month both systems are exported again, and every time a column can end up wrong.
- The keys do not match. The customer is spelled differently in the systems, the project has one number here and another there. The VLOOKUP finds nothing, the total comes out too low.
- The report cannot be shared. The file is emailed, copied and soon lives in three versions with different figures.
- It depends on one person. If the person who built it leaves, the report goes with them.
What changes
- The source data is fetched every night from your systems and the books. Nobody pastes anything in.
- One version, the same figures for everyone. The report sits in your workspace or as a tab in Verksamhetskoll, with permissions.
- The keys are solved once. Customer, project and cost centre match between the systems in the model, not in each file.
- Standard technology that more people know. Power BI, with no add-ons of our own. The reports are yours.
The Excel report you already have is an excellent starting point. We rebuild the logic against the data sources, or you do it yourselves.
Three steps on the same foundation.
Everything stands on the same sources. You choose how far you want to go.
The report builder in Verksamhetskoll
Included, with no licences. Your own statement layouts, dimensions as rows or columns, AI that suggests reports.
See the report builder →Build further in Power BI
A build workspace of your own with your systems and the books in the same model. You build in the browser and share with the right permissions.
How you build it yourselves →We build it for you
Orders, staff, estimates and vehicle data crossed with the finances, delivered as a tab in Verksamhetskoll.
How it works →What is required?
Verksamhetskoll Planning
A subscription with a connection to the accounting system or a file of the books.
Power BI Pro licence
One per person who is going to open the tab or build, taken out by you with Microsoft.
Access to the sources
Read permission to the files or systems that are to be included. We set it up securely.
A contact person
Someone at your end who knows the business's figures and checks that it shows the right thing.
Common questions
Questions about your own reports on your own data.
- What is Custom analysis in Verksamhetskoll?
- Custom analysis is an add-on where your own data sources, for example order systems, staff lists, vehicle data or project estimates, are brought in and crossed with the books from Verksamhetskoll. The analysis is built in Power BI on ready data sources and shown as a tab of its own in Verksamhetskoll, with the same sign-in as everything else.
- Which systems and files can be included?
- Files such as Excel and CSV, systems with an API and databases via a gateway. So far we have read in order systems, transport systems, project estimates with payment plans, staff lists and vehicle data. The books always arrive ready from Verksamhetskoll, whichever accounting system you have.
- How is the quality of our own sources assured?
- Each source is read into a dataflow with a fixed structure: columns, data types and keys that match the books, for example company, customer, project or cost centre. If the file or the system changes, the load stops with yesterday's data kept, instead of the report quietly showing wrong figures. The measures are calculated in the model, not in each report, so the same figure is the same figure in every view.
- We already have a report in Excel that we are happy with. Can you take it over?
- Yes. We rebuild the logic against the ready data sources, so that the report fetches the books every night instead of someone pasting in figures, and place it as a tab in Verksamhetskoll where everyone sees the same version. Spreadsheets that are source data in themselves, for example project plans or payment plans, are read in as they are.
- Can we build our own reports ourselves?
- Yes. You get a build workspace of your own and access to the same data model that our deliveries are built on, with field names in plain language and ready measures. You build directly in the browser, there is nothing to install, and reports you are happy with can become a tab in Verksamhetskoll.
- Do we need Power BI to use Verksamhetskoll?
- No. Verksamhetskoll Planning runs in the browser and needs no Power BI licences. Only the add-on Custom analysis needs a Power BI Pro licence, for each person who is going to open the tab or build their own reports.
- Do we need Power BI Desktop?
- No. The building is done in the browser in your workspace. You open the start report, save a copy, click Edit and drag in fields and ready measures.
- How often are the figures updated?
- Every night. Verksamhetskoll first fetches the books from your accounting system, then the dataflows are updated and finally the model behind the report. In the morning the tab shows yesterday's position, without anyone having to do anything.
- Do the customisations affect the standard product?
- No. The flow goes one way: the analysis reads Verksamhetskoll through a versioned data contract, never the other way round. Budget, forecast, liquidity and health index are calculated as usual and Verksamhetskoll is updated as usual, independently of your customisations.
- What does Custom analysis cost?
- Analyses we build are delivered with a fixed scope, priced in a quote. A build workspace of your own with the books' data sources is included in Planning for organisations, and in the other plans it is set up in a quote. Your own sources are read in as part of a quote. On top of that, each person who is going to open the tab or build needs a Power BI Pro licence, which you take out yourselves. No capacity or other platform fee is added.
Which systems do you want to cross with the books?
Book a walkthrough and we look at your sources and at the report you already have. If you want to build yourselves, we show you the build workspace at the same time.