
What is a liquidity forecast?
The liquidity forecast answers a single question: does the money last? It follows the payments, not the business events. An invoice sent in March with thirty days' credit becomes revenue in March in the income statement, but money only in April, and later than that if the customer runs over. That difference is why profitable companies can still run out of money.
The forecast consists of four parts for each coming month:
- Opening cash. What is in the account when the month begins.
- Receipts. Accounts receivable that fall due, plus the sales expected to be invoiced and paid within the period.
- Payments. Accounts payable, salaries and employer contributions, VAT, preliminary tax, interest and loan repayments.
- Closing cash. The balance that becomes next month's opening cash, and that shows whether it gets tight.
On top of the monthly rows, three figures are needed for the forecast to be actionable: the lowest forecast balance and which month it falls in, how many months the cash lasts at the current pattern, and how much unused overdraft facility is left when it is at its tightest.
Liquidity budget or liquidity forecast?
The terms are used interchangeably, but they do different jobs. The liquidity budget is made before the year and stands still: it is the yardstick. The liquidity forecast is updated during the year, where the months that have passed are actuals from the books and the rest is recalculated against what has actually happened.
Swipe sideways to see the whole table
| Liquidity budget | Liquidity forecast | |
|---|---|---|
| Made | Once, before the period | Continuously, usually every month |
| Based on | Plan and decisions | Actuals so far plus plan for the rest |
| Answers | What we expect the cash to do | What the cash does with what we know today |
| Used for | Follow-up against plan, credit applications | Decisions here and now: investment, hiring, dividend |
Cash flow forecast is often used as a synonym for liquidity forecast. The cash flow statement in the annual accounts is something else, however: it explains historically how the cash changed, divided into operating activities, investing and financing. The forecast looks ahead.
What the spreadsheet requires of you
Most liquidity templates are built the same way: a grid with months in the columns and items in the rows, where you fill in what is expected to come in and go out. The template calculates the total. It knows nothing about your customers.
That means the quality of the forecast rests on four things you enter by hand:
- How large a share of sales is paid in month one, two and three, that is the customers' actual behaviour and not the credit term on the invoice.
- When accounts payable fall due, including the invoices that are already in the books.
- VAT in the right month for your VAT regime, and preliminary tax alongside.
- Salaries, employer contributions, interest and loan repayments, which all have due dates of their own.
The work can be done, and is done in many finance departments every month. The point of building the forecast from the books is that the four items are already there, in your own ledgers and journal entries. They do not have to be typed in a second time, and they do not go stale.
How the forecast is built from the books
- 1
The books are fetched
Verksamhetskoll fetches the books from your accounting system every night, or reads a SIE file. Connections exist to Hogia, Fortnox and Spiris, and SIE 4, the Swedish standard format for exporting accounting data, works with any system. See the integrations.
- 2
The payment patterns are measured
From the history, the average time it takes before your customers pay, and how quickly you pay the suppliers yourselves, is calculated. These become the forecast's two most important assumptions, and they are your own, not a rule of thumb.
- 3
Known items are placed on their due dates
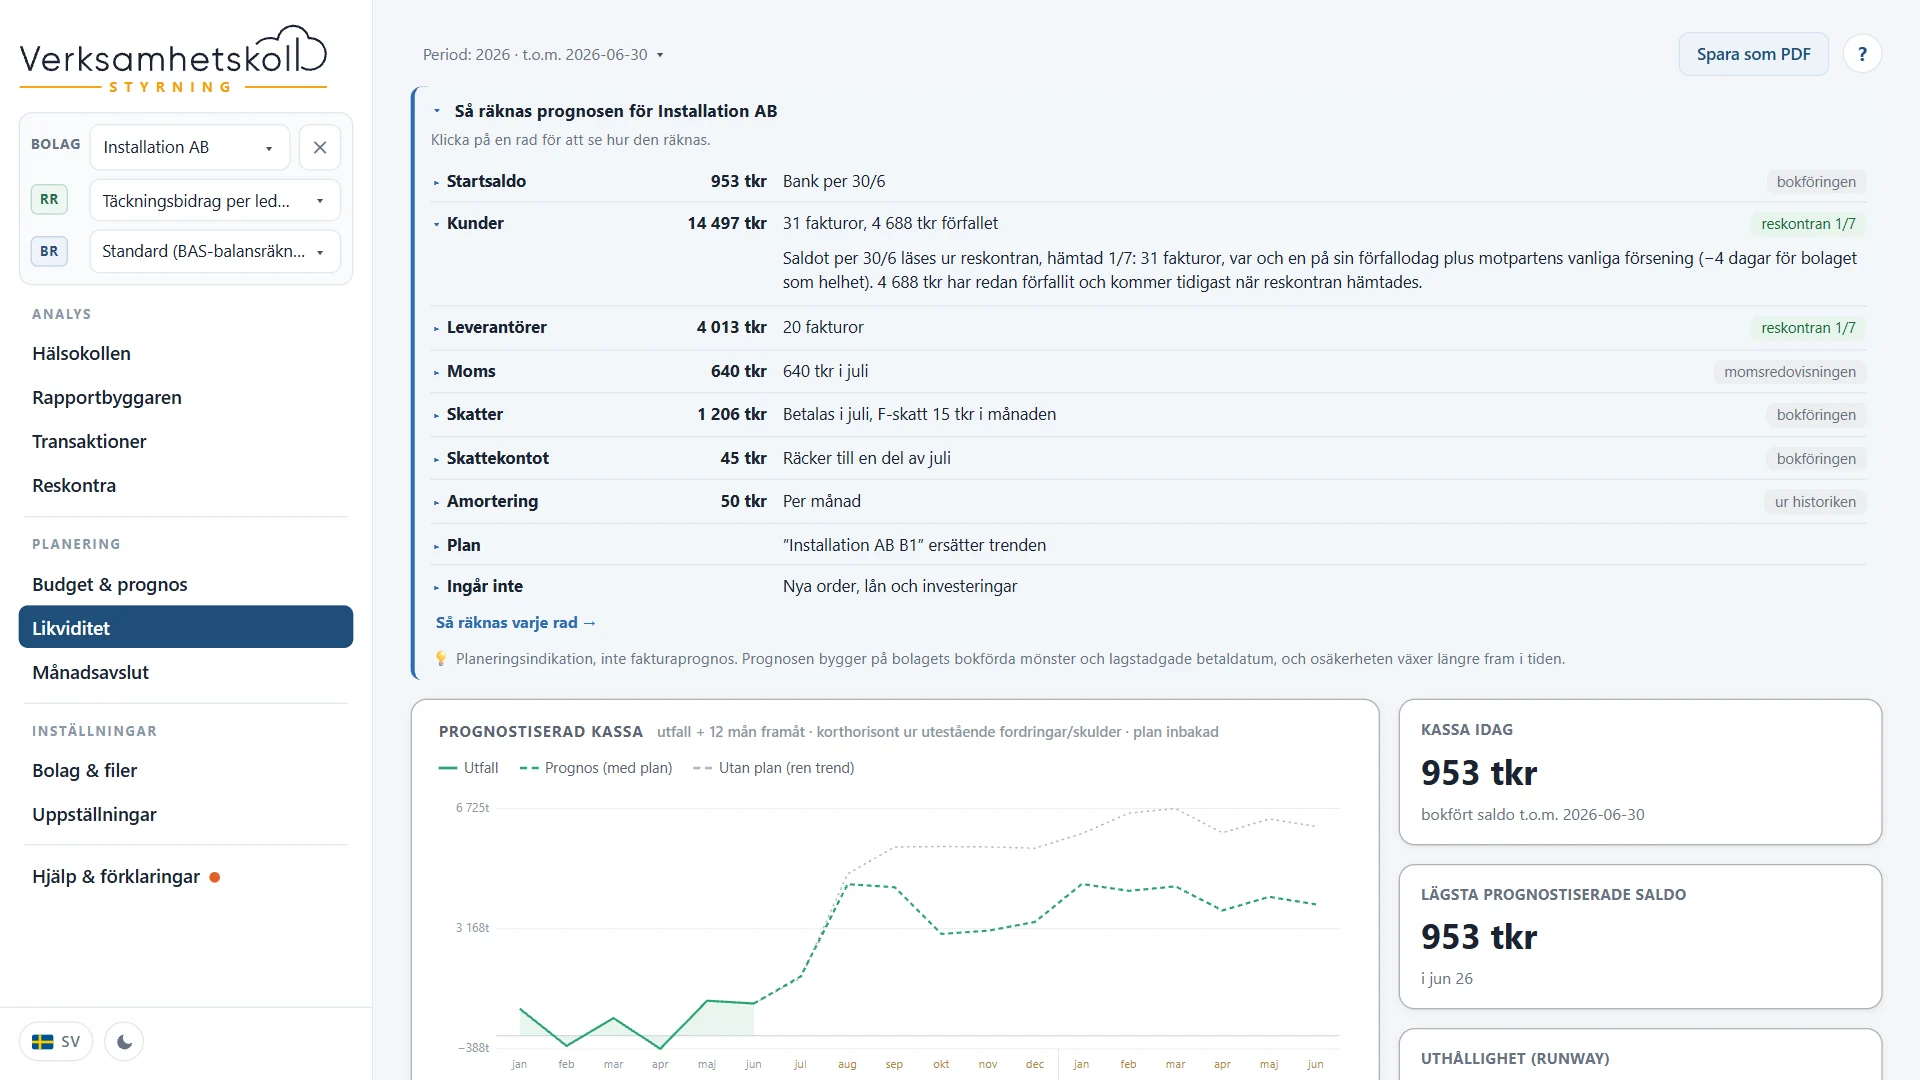
Open accounts receivable and accounts payable fall due where they actually fall due. With a connection to Hogia, Fortnox or Spiris, each open customer invoice from the ledger is placed on its due date plus the delay the customer usually has, and each unpaid supplier invoice on its own. Salaries are placed on pay day, VAT and preliminary tax in the statutory due month for your VAT period, loan repayments according to their plan. Money you have credited on your tax account (skattekontot, your account with the Swedish Tax Agency) pays the tax and the VAT before the bank does.
- 4
The rest of the year is projected
The months ahead are filled with the pattern the business has shown, and can be steered by the budget once you have made one. Months that have passed stay as actuals, so the forecast becomes more certain with every month that goes by.
- 5
The curve is drawn
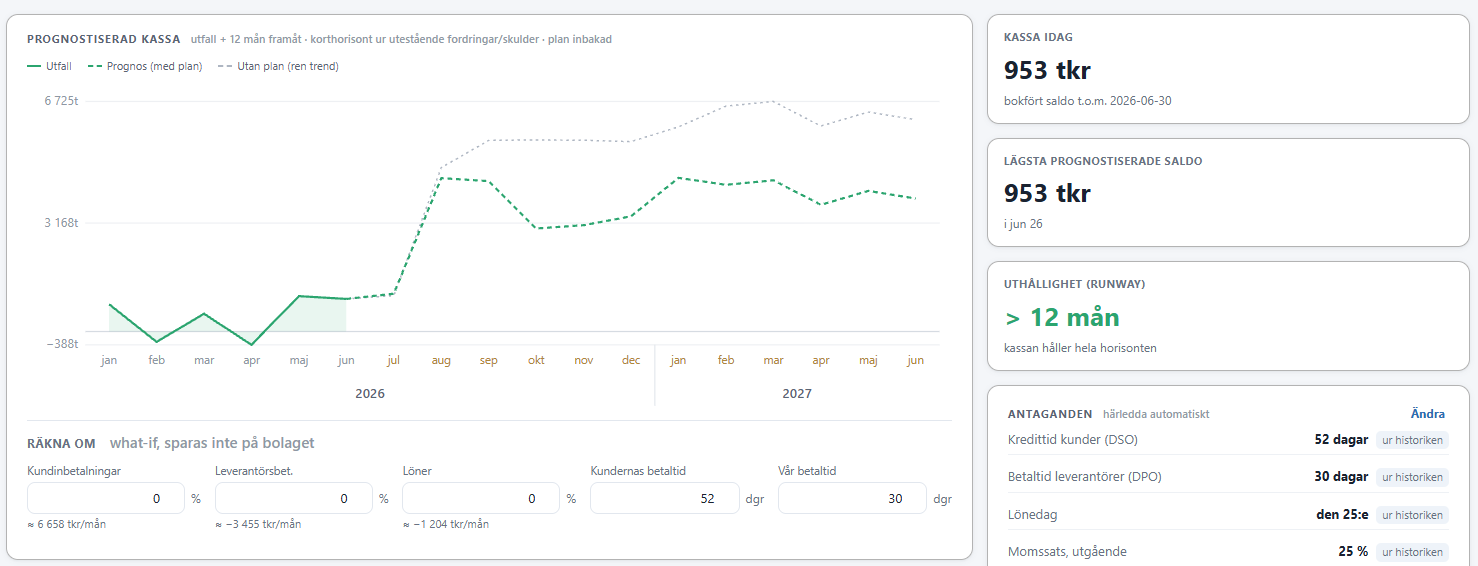
Cash twelve months ahead, with the lowest balance marked, the overdraft facility as a line of its own and a monthly table under the graph where each row can be read item by item.
The assumptions, and where they come from
A forecast is only as good as the assumptions behind it, and the only way to trust it is to see them. That is why they are shown in the view, each with its source. In the demo's fictitious electrical firm they look like this:
Swipe sideways to see the whole table
| Assumption | Value in the demo | Derived from |
|---|---|---|
| Customers' payment time | 52 days | Actual time from invoice to payment in the history |
| Supplier payments | 31 days | The company's own payment pattern |
| Pay day | The 25th | Booked salary payments |
| VAT | Monthly | The VAT period in the company's VAT returns, with the statutory due month |
| Loan repayments | Ongoing, according to plan | Booked repayments |
Try it yourself
The liquidity view in the demo
The demo opens Planning with fictitious companies. Click the Liquidity tab, the view calculates for a few seconds, and the assumptions are under the cards. No sign-up, no figures of your own.
Try it yourselfThe demo opens in Swedish. Switch to English with the SV button at the bottom of the demo's menu.
What happens if customers pay later?
The question is rarely what it looks like if everything continues as now. It is what happens if a large customer runs over, if the machine is bought in October instead of March, or if prices go up five per cent. The Recalculate panel exists for exactly that.
- Five sliders: amounts in per cent and payment times in days, for both receipts and payments.
- The curve is recalculated while you drag the slider, and is marked as a scenario so that it is never confused with the base forecast. The scenario is not saved.
- The overdraft facility as a line of its own, saved on the company. It decides how many months the cash is counted as lasting.
- Your own one-off entries with name, amount and month, for example a machine for SEK 500,000 in October. They are saved on the company and follow along into the PDF and the AI adviser.
The view also has four ready-made questions for the AI adviser, asked about the cash instead of the result. One example is when the cash is at its lowest and what that depends on. The answer is calculated on the company's own figures and points to the months concerned, and can be taken further with follow-up questions, suggested or your own. The forecast can be saved as a PDF when it is to go to the bank or the board.
Liquidity in a group
A group does not have one cash position, it has several. The companies have different customers, different credit terms and often different accounting systems, and they also pay each other. If the figures are simply added together, the internal payments are counted twice.
In Verksamhetskoll each company is forecast with its own patterns, and the curves are then summed into a group cash position where intra-group payments cancel each other out. The questions to the AI adviser also work on the summed cash. The company's cash is included in Planning, the group's cash in Planning for organisations. How the consolidation works in other respects is described on the page about group consolidation.
How to do it in Verksamhetskoll
The liquidity forecast is a tab in Verksamhetskoll Planning, not a separate model that has to be maintained. It is recalculated when the books are updated, which happens every night if you have a connection to the accounting system.
- Cash twelve months ahead with opening balance, receipts and payments and closing balance per month.
- Cards for Cash today, runway in months and the lowest forecast balance with its month.
- The assumptions openly shown with their source: customers' payment time, supplier payments, pay day, VAT period and loan repayments, and changeable under Edit.
- The open customer and supplier invoices from the ledgers on their due dates, with a connection to Hogia, Fortnox or Spiris.
- The tax account is counted: what is credited there pays the tax and the VAT before the bank does.
- The Recalculate panel with five sliders and recalculation while you drag, and the overdraft facility and one-off entries saved on the company.
- Four ready-made questions for the AI adviser, asked about the cash, follow-up questions in the same dialogue, and the forecast as a PDF.
- Group view where the companies' curves are summed and intra-group payments cancel each other out, in Planning for organisations.
Storage and AI processing are in Microsoft Azure Sweden Central. Prices and terms are published on the pricing page, and the whole product can be tried in the demo without signing up.
Common questions
Questions that often come up.
- What is a liquidity forecast?
- A liquidity forecast shows how much money is expected to be in the account at each coming month end. It is based on when money actually moves, that is when customers pay and when suppliers, salaries, VAT, tax and loan repayments fall due, unlike the income statement, which shows when the revenue and the cost arise.
- What is the difference between a liquidity budget and a liquidity forecast?
- The liquidity budget is the plan made before the year and it stands still. The liquidity forecast is the updated assessment during the year, where months that have passed are actuals from the books and the rest is recalculated against reality. In practice the terms are used interchangeably, but it is the forecast that answers the question of whether the money lasts through November.
- How far ahead does the forecast calculate?
- Twelve months ahead, month by month. Each month is shown as opening cash, receipts and payments, and closing cash, together with the lowest forecast balance during the period and how many months the cash lasts at the current pattern.
- Do we have to fill in credit terms and payment patterns ourselves?
- No. Payment times are derived from the books: how long it actually takes before your customers pay, how quickly you pay your suppliers, which day salaries are paid and which VAT regime you are on. With a connection to Hogia, Fortnox or Spiris, each open invoice is also placed on its due date, plus the delay the customer usually has. The assumptions are shown openly in the view with their source, and can be changed under Edit when you know something the history does not. The change is saved on the company and applies to everyone who opens it.
- Can we test what happens if customers pay later?
- Yes. The Recalculate panel has sliders for amounts and payment times. The curve is recalculated while you drag the slider and is marked as a scenario, so it is never mixed up with the base forecast, and the scenario is not saved on the company. The overdraft facility and your own one-off entries, for example a machine investment in October, are instead saved on the company and follow along into the forecast, the PDF and the AI adviser.
- Does the liquidity forecast work for a whole group?
- Yes, in Planning for organisations. Each company is forecast with its own credit terms and its own payment pattern, and the curves are summed into a group cash position where intra-group payments cancel each other out. The forecast can also be asked about in the group view.
- Where are the figures stored?
- Accounting data is stored, processed and AI-analysed in Microsoft Azure Sweden Central. The books are fetched from your accounting system, or read in as a SIE file.
Further reading