
What is financial follow-up?
Reporting and follow-up are often used as synonyms, but they do different things. Reporting describes what happened. Follow-up asks why, and leads to a decision. An organisation that reports without following up produces correct documents that nobody acts on.
Follow-up that works rests on four comparisons, and you need all four:
- Against budget. Are we doing what we decided? Requires that the budget is broken down to the same level as the actuals are reported.
- Against the previous period. Are we moving in the right direction? Catches what the budget missed when it was set.
- Against the industry. Is the level reasonable? An operating margin of four per cent can be strong or weak depending on the industry.
- Against the future. Does the plan hold? This is where follow-up meets the liquidity forecast.
What should the monthly report contain?
There is no prescribed template for an internal monthly report, unlike the annual report. What still recurs in reports that are actually used is seven parts:
- 1
Income statement, month and year to date
The month on its own and the year so far, so that a single deviating month is not read as a trend.
- 2
Actuals against budget
In SEK and in per cent, per row. Without the percentage, small but fast-growing variances drown among large items.
- 3
Comparison against the previous year
The same period last year, to tell season from change.
- 4
Balance sheet with equity and equity ratio
Accounts receivable, inventory, accounts payable and interest-bearing debt are the items that most often explain why profit and cash say different things.
- 5
Cash flow and liquidity going forward
What happened to the money, and the forecast for the coming months.
- 6
Key ratios with a comparison
A few figures, always the same, with a reference point. Key ratios without a comparison say almost nothing.
- 7
Comment on the variances
The largest variances, the cause behind each, and what is being done. It is the part the board reads first and the one most often missing.
Which key ratios are worth following?
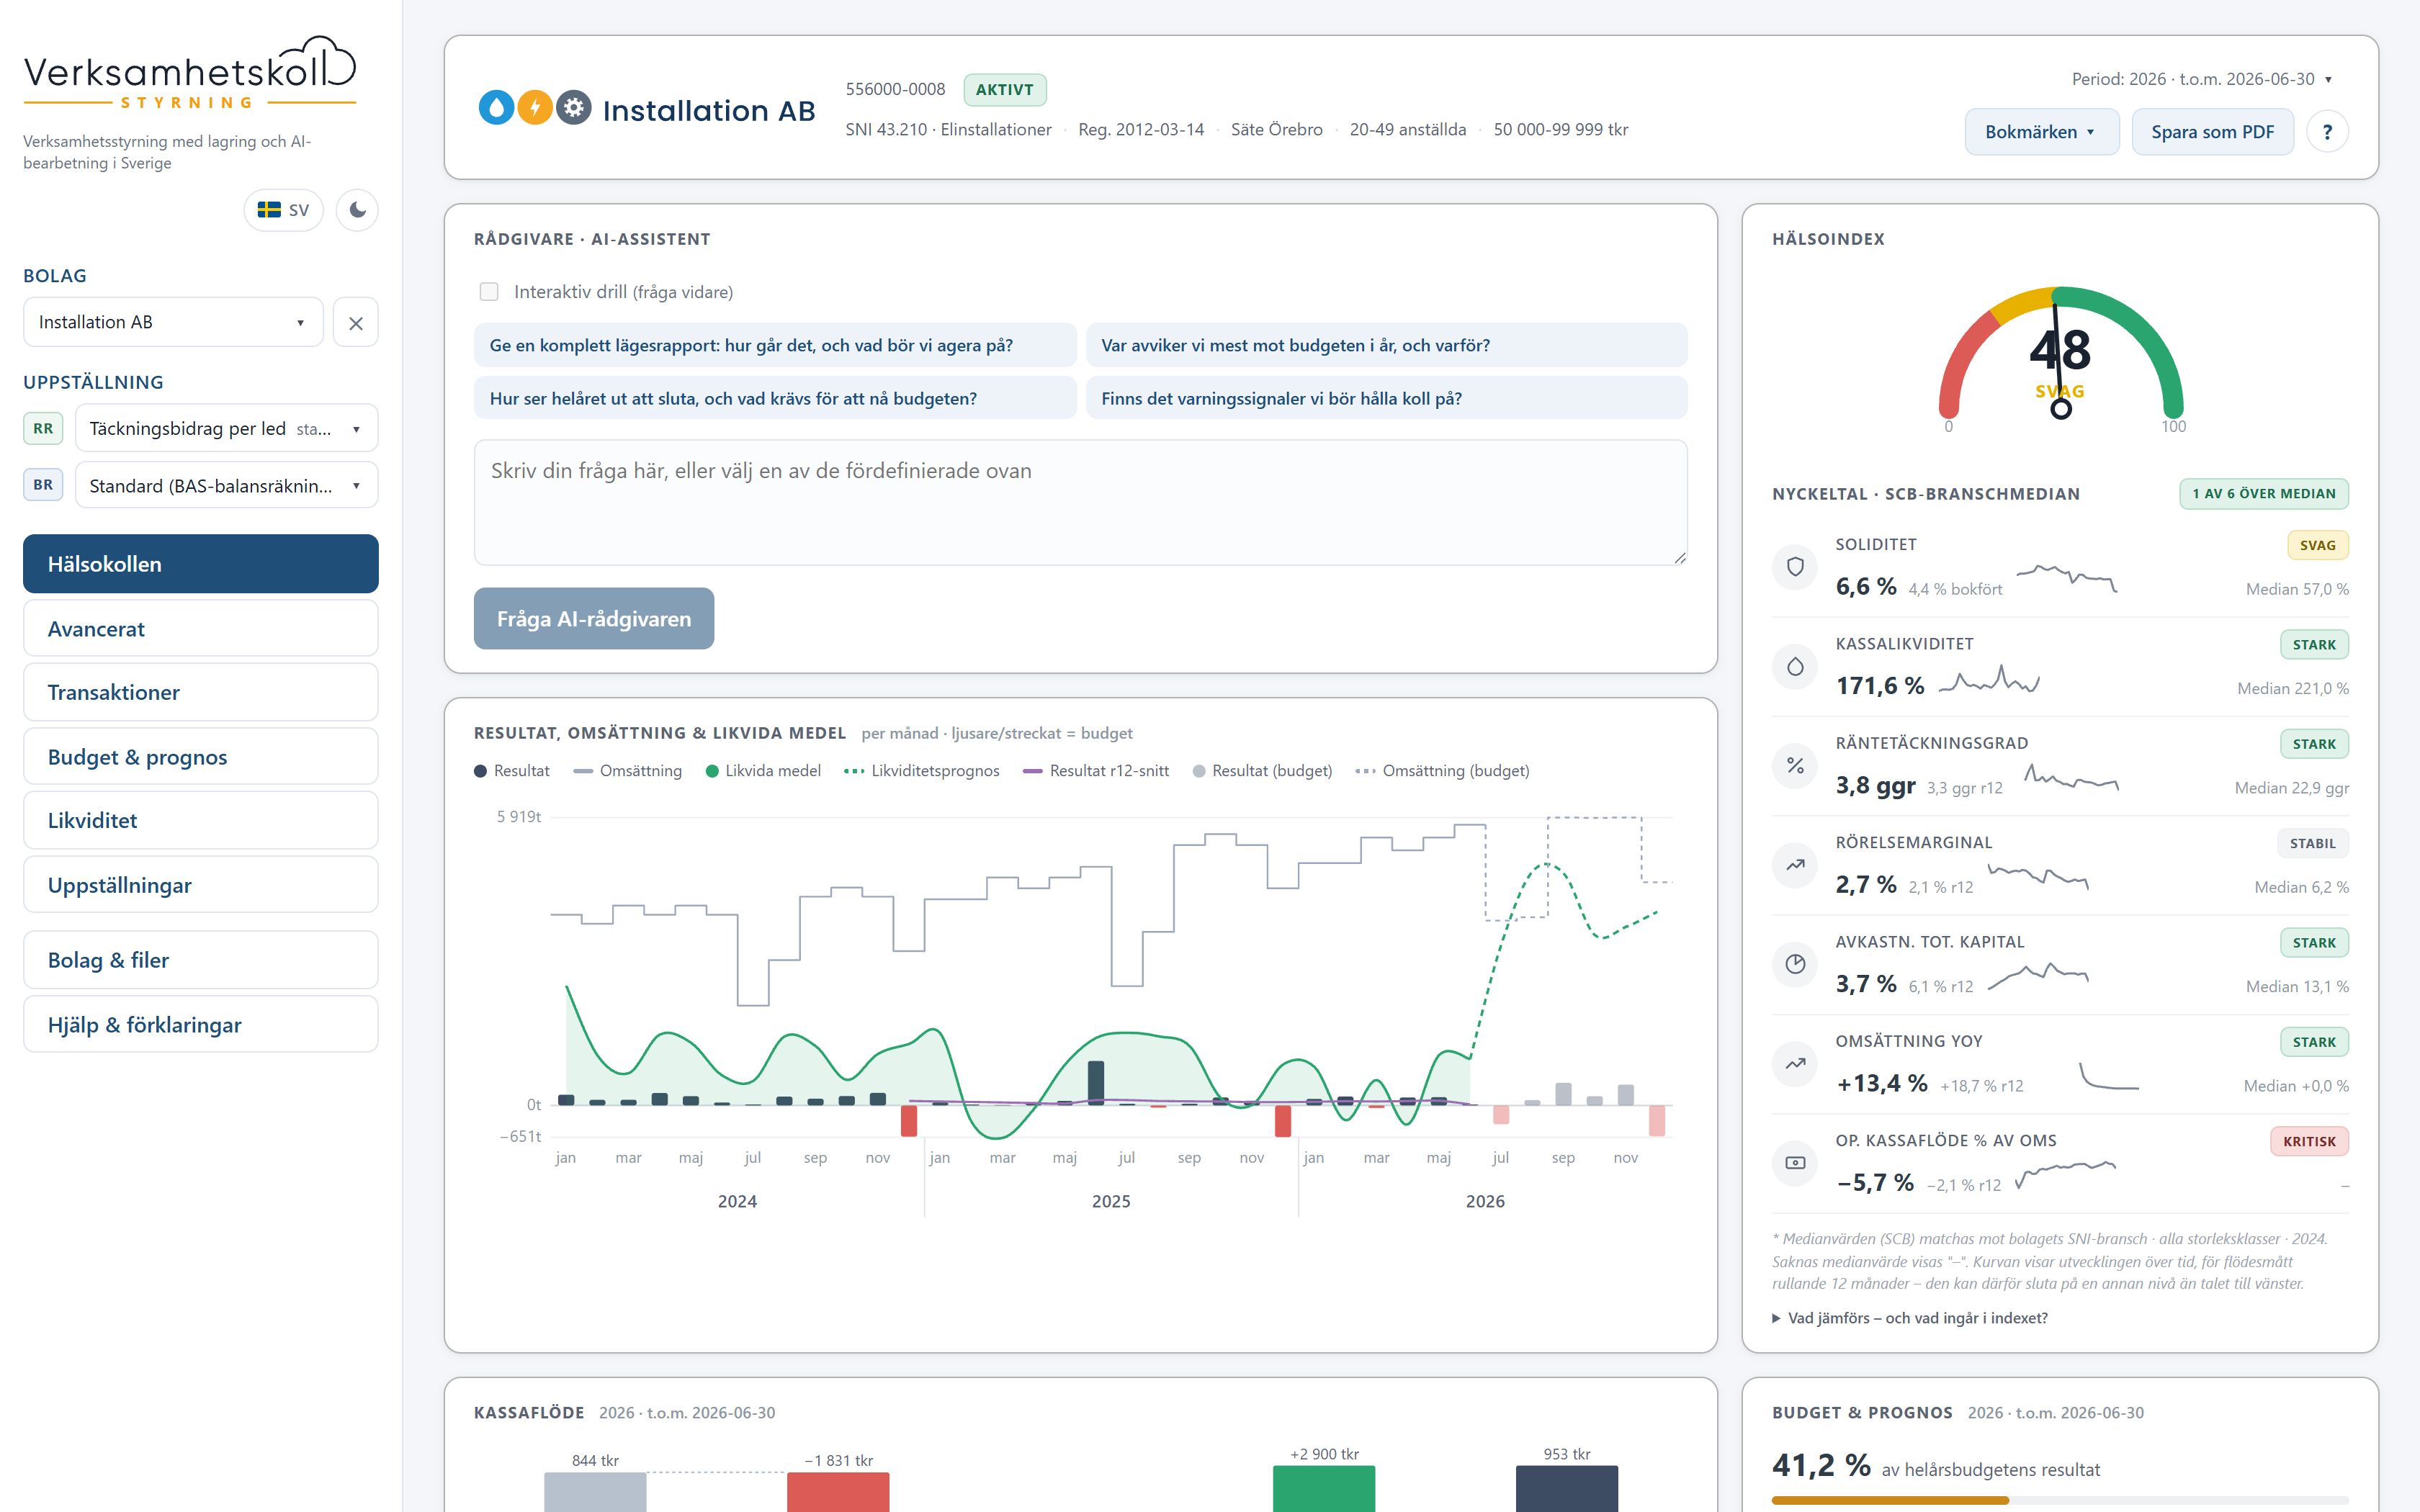
A key ratio without a reference point is just a number. Six measures are therefore compared directly against the SCB median for the company's own industry, so that the level can be judged without industry experience:
Swipe sideways to see the whole table
| Key ratio | Answers |
|---|---|
| Equity ratio | How large a share of the assets is financed with equity. |
| Quick ratio | Whether the current liabilities can be paid without selling inventory. |
| Interest coverage | How many times operating profit covers the interest expense. |
| Operating margin | How much of revenue is left as operating profit. |
| Return on total assets | What the capital in the company yields, regardless of how it is financed. |
| Revenue growth | Whether the company is growing, and at what rate. |
The health index is a quick summary, not an answer key. It is calculated on the account classification and is therefore not affected by which report layout you have chosen: the same company gets the same index whether the result is shown as the standard layout or as a board report.
Try it yourself
The overview in the demo
The demo opens with a fictitious installation company. The health index is at the top, the key ratios below it with their comparison against the industry median, and the period picker at the top right controls the index, key ratios, charts and AI answers.
Try it yourselfThe demo opens in Swedish. Switch to English with the SV button at the bottom of the demo's menu.
The report in the language of the business
A standard layout according to BAS (the Swedish standard chart of accounts) is right for external readers and wrong for most internal ones. An installation firm thinks in contribution margin per stage, a property company in property management result with rental income split into housing, premises and garages. If the report is written in a language other than the business's own, it is put aside.
That is why you build your own statement layouts, and they carry through everywhere: in the report builder, in the PDFs, in the overview and in how the AI adviser phrases things about the result. Switch layout in the sidebar and the view is redrawn straight away.
- Several layouts per company, and shared layouts that apply to all companies, for example a board report.
- Accounts that no row places end up on a row of their own for unplaced accounts, so the total can never be wrong.
- Reclassified accounts are expressed against the BAS group, so that all layouts, key ratios and AI data are corrected at the same time.
- The layout controls the rows of the reports, never the health index or the equity ratio. They are calculated on the account classification.
From variance to journal entry
This is the step where follow-up is decided. A report showing that material cost is four hundred thousand over budget is the start of a piece of work, not the end: someone has to find out what it is caused by, and that route normally goes through a question to accounting and an answer a few days later.
- 1
Click the figure
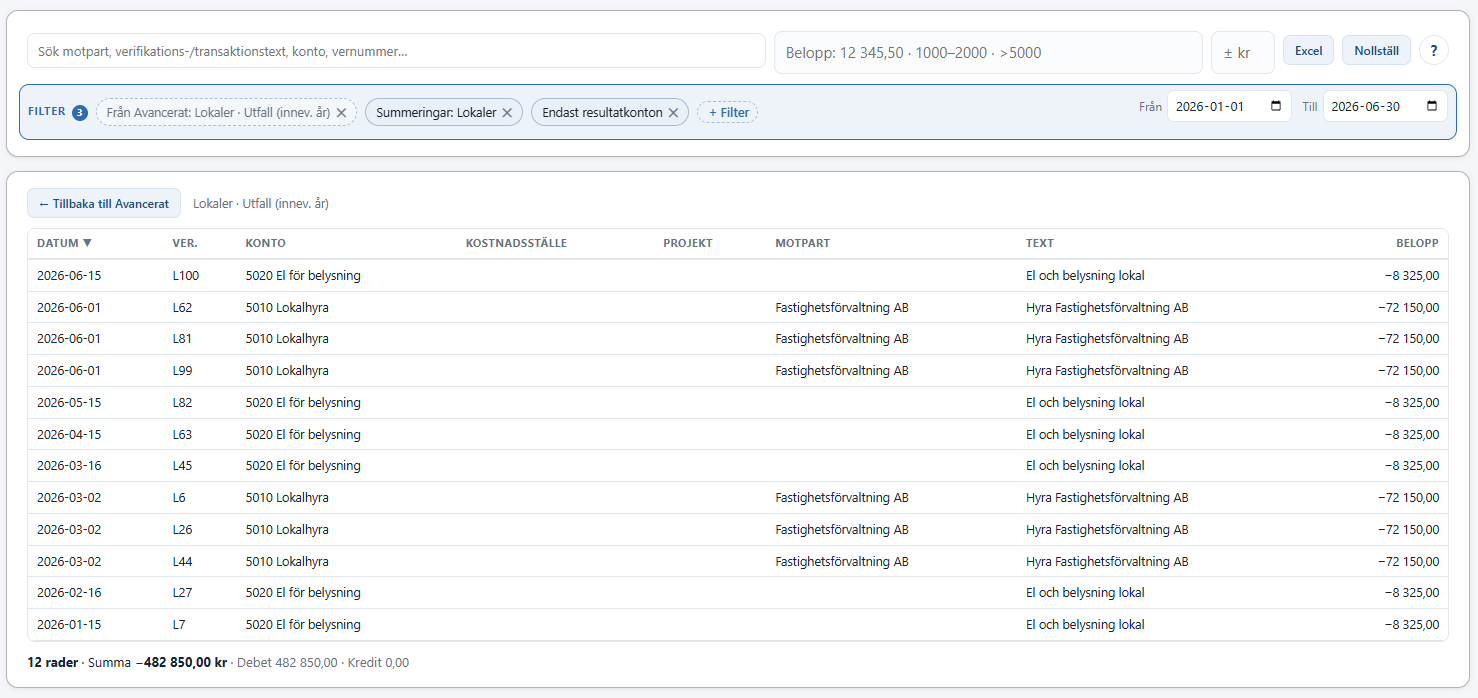
The amount in the report opens the transactions view with the filter from the report and the rows behind exactly that cell. The table footer sums exactly the amount you clicked, so you know you are seeing the full basis.
- 2
Read the rows
Date, journal entry number, account, the dimensions of the books, counterparty and amount including öre (hundredths of a krona). The search box takes an exact amount, a range or greater than a value, with a tolerance in SEK beside it, and free text on counterparty, entry text, account or entry number.
- 3
Expand the journal entry
One click on the row expands the whole journal entry directly below it, with counter accounts and VAT in balance. The journal entry's attachment, for example the invoice, opens from there when the books are fetched from Hogia, Fortnox or Spiris.
- 4
Ask further
The AI adviser answers why the item deviates, broken down by dimension, account and counterparty, and suggests follow-up questions. The answer can be copied with its formatting straight into the board papers.
A monthly routine that lasts
What breaks follow-up is rarely a lack of will, but a routine that takes too long. If the monthly review takes two days to prepare, it becomes quarterly, and then half-yearly. A routine that lasts looks roughly like this:
- The books are fetched automatically every night, so the figures are ready when the month is closed.
- The overview is read first: health index, the key ratios against the industry median and the result against budget.
- The three largest variances are drilled down to journal entries, and the cause is written down while it is known.
- The forecast is updated for the rest of the year, and liquidity is checked against it.
- The report package is printed as a PDF with your own logo, the comment is entered, and the package is sent to management and the board.
The report builder makes steps two and three faster with saved bookmarks: rows, columns, measures and filters stay as you set them, and the report can be printed as a PDF or exported to Excel. The AI adviser can also suggest reports based on what the business's revenue, costs, customers and dimensions actually look like, with a rationale for each suggestion.
The monthly letter arrives by email the day after the month has been booked. The month-end agent does the follow-up when the month has been booked, and you approve the report.
If someone at your company wants to cross the order system, the calculations or the timesheets with the same books, there are your own reports in Power BI on quality-assured data from your systems as an add-on.
How to do it in Verksamhetskoll
Verksamhetskoll Planning reads the books from your accounting system and turns them into follow-up you can act on, from the overview down to the individual journal entry.
- Overview with a health index from 0 to 100 and six key ratios compared against the SCB industry median, controlled by the period picker.
- Your own statement layouts that carry through into reports, PDFs and AI answers, with a guarantee that no accounts fall between the rows.
- Report builder with free combinations of rows, columns, measures and filters, PDF and Excel. Reports are saved as bookmarks in folders, and in Planning for organisations they can be shared with everyone.
- Drill from report cell to journal entry rows, and on to the whole journal entry with counter accounts and VAT.
- Amount search across the whole books: exact amount, range, greater than, with tolerance and free text.
- Monthly report as a ready PDF package with your own logo.
- AI adviser with ready-made questions for status report, budget variances, full-year forecast and warning signals, your own questions in free text and follow-up questions in the same dialogue.
The books are fetched every night through a connection to Hogia, Fortnox or Spiris, and SIE 4 works with any system. Storage and AI processing are in Microsoft Azure Sweden Central. Prices and terms are published on the pricing page.
Common questions
Questions that often come up.
- What is financial follow-up?
- Financial follow-up is regularly comparing actuals against budget, against the previous year and against the industry, understanding what the variances are caused by and acting on them. What separates follow-up from reporting is the last step: a report describes, a follow-up leads to a decision.
- What should a monthly financial report contain?
- A monthly report for the board and management normally contains the income statement for the month and year to date, actuals against budget and against the previous year, the balance sheet with equity and equity ratio, cash flow and liquidity going forward, key ratios with a comparison, and a short comment on the largest variances and what is being done about them. The comment is the part that is often missing, and the one the board reads first.
- Which key ratios are compared against the industry?
- Six key ratios are compared directly against the SCB median for the company's own industry (SCB is Statistics Sweden): equity ratio, quick ratio, interest coverage, operating margin, return on total assets and revenue growth. On top of that, a health index between 0 and 100 is calculated against fixed target values for eight components.
- Can we get the report in our own account structure?
- Yes. You build your own statement layouts, for example contribution margin per stage in an installation firm or property management result in a property company, and they carry through into the reports, the PDFs and the way the AI adviser describes the result. Accounts that no row places end up on a row of their own for unplaced accounts, so the total can never be wrong.
- How far can you drill into a figure?
- Click the amount in the report and the transactions view opens with the rows behind exactly that figure, and the table footer sums exactly the amount you clicked. One click on a row expands the whole journal entry with counter accounts and VAT in balance, and with a connection to Hogia, Fortnox or Spiris the journal entry's attachment, for example the invoice, opens from there.
- How often are the figures updated?
- With a connection to Hogia, Fortnox or Spiris, the books are fetched every night, so the figures are ready in the morning, and a run can always be started on the spot. SIE 4, the Swedish standard format for exporting accounting data, works with any system and is read in when you upload a new file.
Further reading